Fun charts

(Source: The Big Picture)

(Source: Stock Charts.com)
The wildest move is from October 1929 to the spring of 1930 when the market pretended to recover. No one knew when it began that "it" was going to continue for decades. But that 1932 low of 41 was certainly the buying opportunity of the millennium.
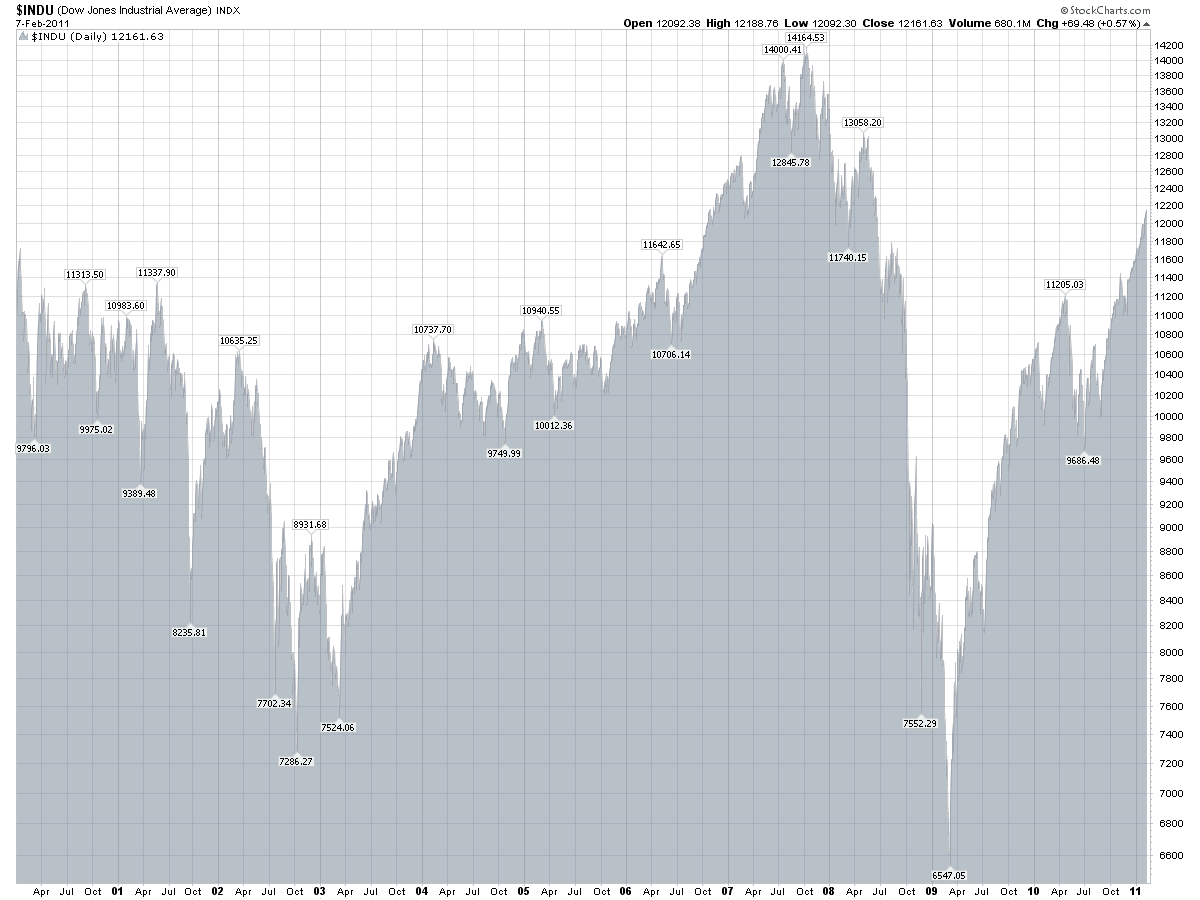
Here we are today, kinda back where we were at 2000.

And my favorite, showing 100 years. I am simple-minded, but if I take a ruler and lay it across the bottom chart, following the progression of highs upwards, the right top edge of the ruler does not end up at 11,500.